Next
Previous
Index
What's GMT?
Example 1: Scaled survey data plotting [sample data attached]
Measurede points (small circle), triangulation from meausred points
(thin blue lines), contourlines derived from triangulation (orange dotted
lines), linear features (grey line), and shade with contourline based
on gridded DEM. Finished with Adobe Illustrator. All data and scripts
are in budo01 folder.
Script and files (abc.efg) to create this map are as follows. Delete
comments, [ to ], for execution.
[antialiasing]
blockmedian xyz.prn -R975/1035/985/1045 -I0.5
> xyzm.prn
[gridding]
surface xyzm.prn -Gbudo.grd -R -I0.5 -T0
[color pallette]
makecpt -Ctopo -T970/1010/0.5 > budo.cpt
[shade]
grdimage budo.grd -R975/1035/985/1045 -JX15 -Cbudo.cpt
-P -K >budo1.ps
[contour]
grdcontour budo.grd -R -JX -C1 -P -A- -O -K
>> budo1.ps
[line plot]
psxy lines.prn -R -JX -W2 -M -O -K >> budo1.ps
[point plot]
psxy points.prn -R -JX -Sc -O -K >> budo1.ps
[contour]
pscontour xyzm.prn -R -JX15 -Cbudo.cpt -L0.5/0/200/200p
-P -W0.7p -B10g10 -O >> budo1.ps
Example 2: Scaled survey data plotting
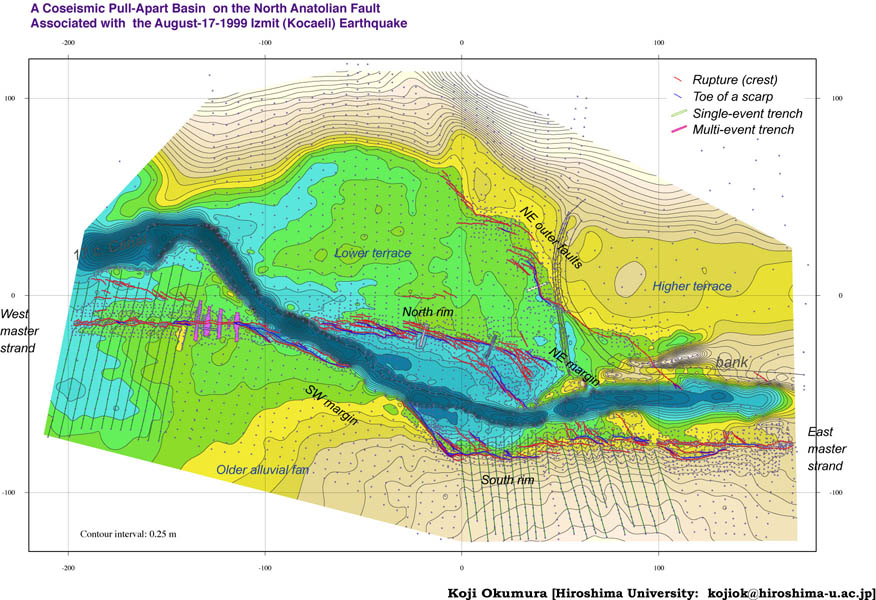
The most detailed snapshot of pull-apart deformation, east of Izmit, during
the 1999 Kocaeli earthquake on the North Anatolian fault.
Example 3. DEM based shaded relief map and seismological data
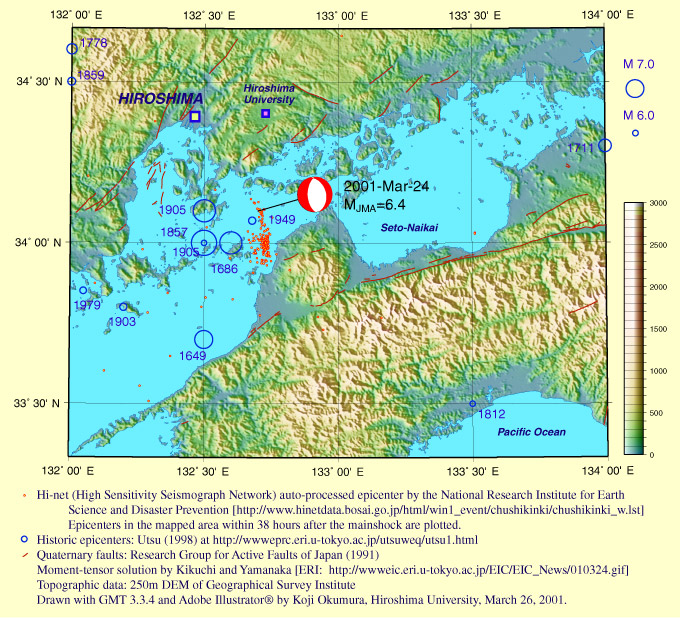
Shaded relief using 250m DEM, main shock CMT solution, aftershockes,
historic epicenters, and scale.
Finished by Adobe Illustrator. Part of the script is shown.
[shaded relief]
grdimage jpn250.grd -R132/134/33:20/34:40 -JT133/6 -Chiro.cpt -Ijpn250i.grd
-P -K > hiroshima.ps
[epicenters]
psxy iyoepi.prn -R -JT -Sc -G255/0/0 -P -B1g1 -O -K >>
hiroshima.ps
[CMT solution]
psmeca iyo2.d -R -JT -Sc0.5 -P -B0.5g0.5 -O -K >>
hiroshima.ps
[scale bar]
psscale -D4/2/4/0.3 -I -Chiro.cpt -P > hiroscale.ps
Next
Previous
Index