|
|
|
related files & commands |
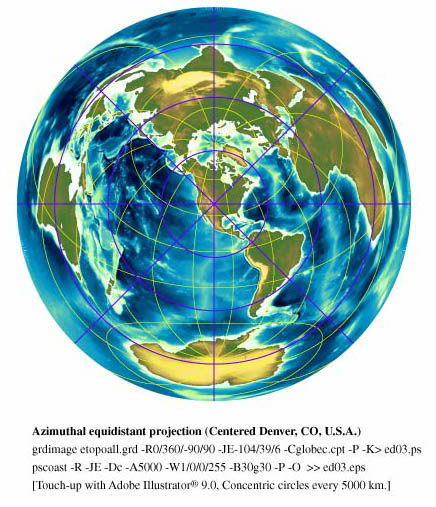 |
Azimuthal Equidistant Projection (-JE) etopo5 DEM (drawn with GMT version 3.2) |
*** ed03.txt -Cglobec.cpt grdimage, pscoast |
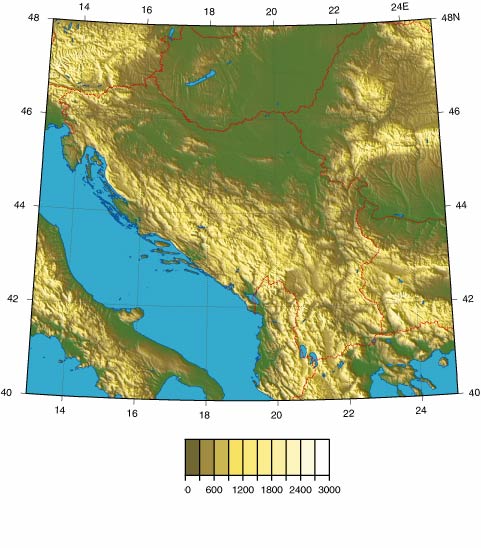 |
Transverse Mercator Projection (-JT) gtopo30 DEM |
grdimage, pscoast |
 |
Mercator Projection (-JM) gtopo30 DEM Utsu (1996) Catalog of World Earthquakes |
sumaepi.prn sumayr.prn grdgradient, grdimage ,pscoast, psxy |
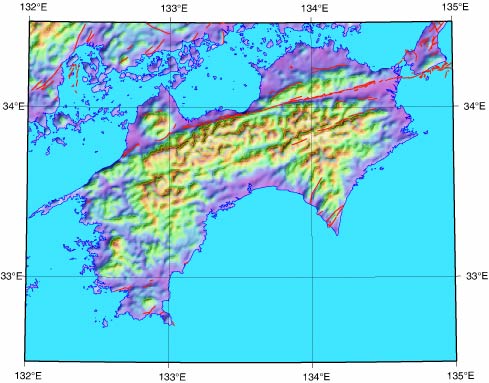 |
Transverse Mercator Projection(-JT) gtopo30 DEM Research Group for Active Fault in Japan (1991: x-y data, Courtesy of Prof. Kumamoto) |
afd2s.dat (part)
grdgradient, grdimage |
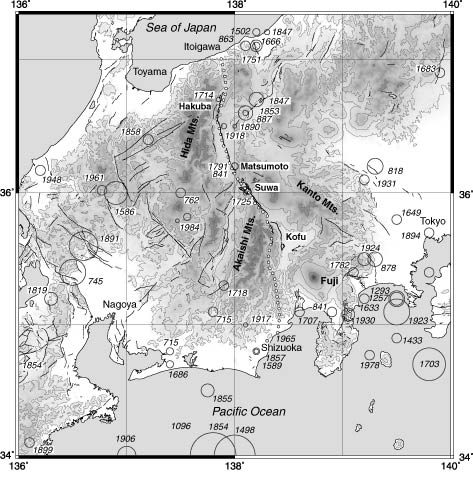 |
Mercator Projection, gtopo30 DEM Utsu (1996) Catalog of World Earthquakes Research Group for Active Fault in Japan (1991: x-y data, Courtesy of Prof. Kumamoto) |
grdimage, grdcountour pscoast, psxy, pstext |
 |
Mercator Projection, Geographical Survey Institute 50m DEM (Digital Map 50, Elevation) [Only shaded relief by GMT] |
surface, makecpt, grdgradient, grdimages |
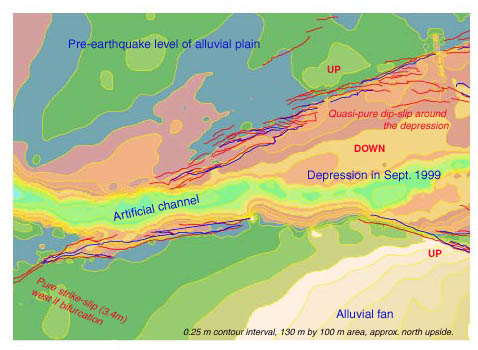 |
Linear X-Y plot (-JX) Contour interval 0.25m EDM (Total Station) survey xyz data (approx. 130m by 100m area with 3000pts) Surface ruptures and pull-apart depression formed in the August 17, 1999 Earthquake on the North Anatolian fault near Izmit. red and blue lines are crest and toe of scarps. |
surface, makecpt, grdimage grdcontour, psxy |