Next
Previous
Index
Construction of GMT commands
-What parameters are necessary to draw a map? You can easily answer:
-Area, projection, scale, data to be used, simplification to match the scale,
line width and color, land and sea color, grid lines...
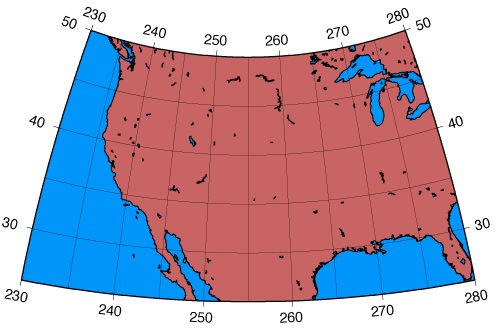
FIRST MAP!
This is a basic GMT command line (one line without line break).
[in GMT 4]
pscoast -R-130/-80/25/50 -JT-105/16 -Di -A100 -W1p0/200/100 -G200/100/100 -S0/150/250 -B10g5 -P > first.ps
[in GMT 5]
pscoast -R-130/-80/25/50 -JT-105/16 -Di -A100 -W1p,0/200/100 -G200/100/100 -S0/150/250 -B10g5 -P > first.ps
Copy those two lines above and paste to a text editor window.
Remove the line break, copy all and paste to MS-DOS / Terminal window.
Then enter. If a prompt appears without any error message, your output
map file first.ps is ready in the working directory. Open the file
using
GSview or Adobe Illustrator.
You did it!
hyphen plus an upper case character (-R, -J, ...) indicates the
meaning of following parameters.
Area (-R) : -Rwest/east/north/south or -Rwest/south/east/north/
r, -Rxmin/xmax/ymin/ymax
Projection (-J): -JT-105/16 means Transversal Mercator projection
with central meridian 105°W, mapwidth 16 cm.
Data (-D): -D for coastline data only. f: full, h: high, i:
intermediate, l: low, and c: crude resolution dataset.
Simplfy (-A): -A100 exclude an object less than 100sqkm from plotting.
Line width and color (-W): 2p = 0.48 pt width, R/G/B each 0 to 255,
or grayscale 0 to 255.
Land color (-G) and Water area color (-S): R/G/B each
0 to 255
Bounds and grids: -B10g5 means tick and annotation every 10 degrees
and gridlines every 5 degrees.
-P for portrait layout, > redirects the output to the file "first.ps".
Adobe Illustrator has a function to select objects
with the same line and fill properties.
In GMT plotting, select different colors for differnt group of objects.
When an PS file is opened in Illustrator, select all > ungroup and release
compound objects.
Then, activate an object, select > same > fill & stroke,
then tune fill & stroke.
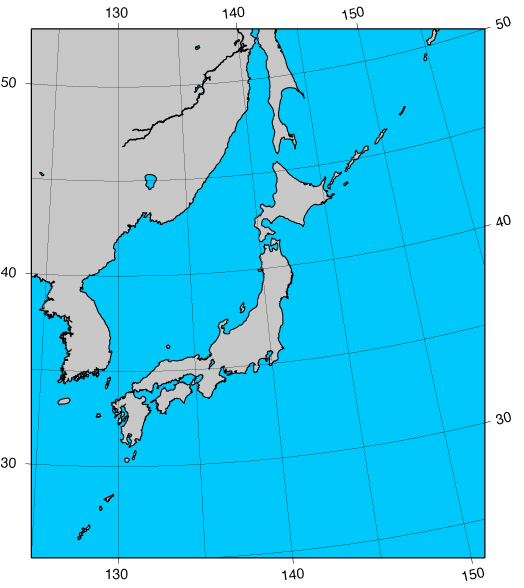
Now, change the parameters and plot different maps.
For example, Japan in Albers profection.
-R125/25/160/50r creates rectangular map with Lower Left Corner = 125 deg. E, 25 deg. N and Upper Right Corner = 160 deg. E, 50 deg. N.
[in GMT 4]
pscoast -R125/25/160/50r -JB130/40/30/45/16 -Di -A200 -W1p0/100/100 -G200 -S0/200/250 -B10g5 -P > second.ps
[in GMT 5]
pscoast -R125/25/160/50r -JB130/40/30/45/16 -Di -A200 -W1p,0/100/100 -G200 -S0/200/250 -B10g5 -P > second.ps
Next
Previous
Index