Next
Previous
Index
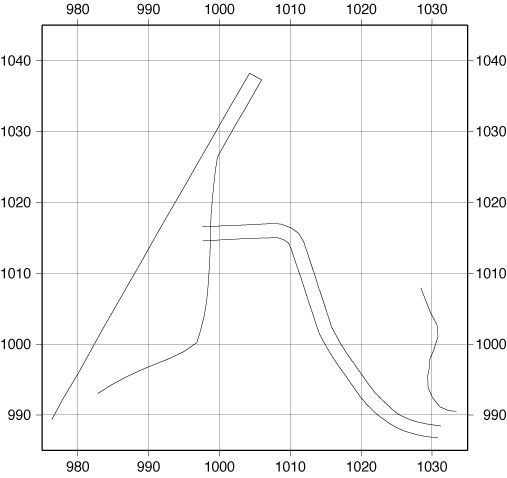
psxy for discontinuous
linear features
Find sample data files and scripts in /GMT_data/budo01
Important: > to delimit an discrete line in data file, -M to indicate
it.
psxy lines.prn -R975/1035/985/1045
-JX15 -W2 -M -B10g10 -P > budo1.ps
-JX is non-geographic graph projection. In this example (xmax-xmin)/(ymax-ymin)=1,
then -JX15 means 15cm by 15cm plot area. If (xmax-xmin)/(ymax-ymin)
= a/b, -JXa/b.
-M is important to indicate there are multiple discontinuous lines delimited
by > in
the data file.
TS E-N-H data are first arranged using Excel as follows.
annotation ptID Easting Northing Height
...
step_west 1065 1026.196 987.696
994.491
step_west 1066 1027.443 987.339
994.479
step_west 1067 1028.568 987.077
994.427
step_west 1068 1029.742 986.902
994.364
step_west 1069 1030.828 986.833
994.276
BS 1070 1022.382
997.665 995.511
road 1071 982.833
993.014 1000.442
road 1072 984.762
994.231 1000.444
road 1073 986.835
995.347 1000.431
road 1074 988.852
996.307 1000.422
...
For discontinuous linear feature plot, we need E and N data sets
delimited by > between each lines.
...
1026.196 987.696
1027.443 987.339
1028.568 987.077
1029.742 986.902
1030.828 986.833
>road
982.833 993.014
984.762 994.231
986.835 995.347
988.852 996.307
...
> is inserted between lines. > can be followed by short comment.
Next
Previous
Index