Next
Previous
Index
symbols
Find sample data files and scripts in /GMT_data/budo01
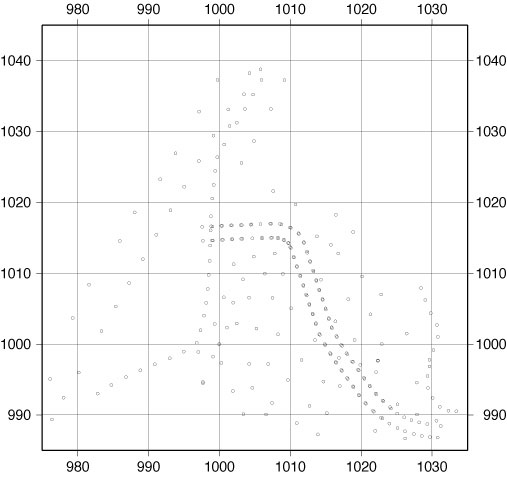
psxy points.prn -R975/1035/985/1045
-JX15 -Sc -B10g10 -P > budo1.ps
Plotting symbols in the size defined by the third column of the data set.
-Sc is to take the third column value as a diameter of a circle. In
this example,
all measured points are plotted. For epicenter plot, calculate the
diameter to be
proportional to the magnitude or energy.
A part of the data set.
Easeting Northing diameter
1022.385 997.685 0.1
997.674 1014.606 0.1
998.976 1014.647 0.1
999.093 1014.643 0.1
1000.374 1014.721 0.1
1000.495 1014.722 0.1
1001.755 1014.795 0.1
1001.867 1014.808 0.1
1003.121 1014.862 0.1
1003.260 1014.880 0.1
1004.674 1014.932 0.1
Next
Previous
Index