TimeTubes: Visualization of Polarization Variations in Blazars

M. Uemura, R. Itoh, L. Xu, M. Nakayama, H.-Y. Wu, K. Watanabe, S. Takahashi, and I. Fujishiro, “TimeTubes: Visualization of Polarization Variations in Blazars”, Galaxies, 4, 23, 2016

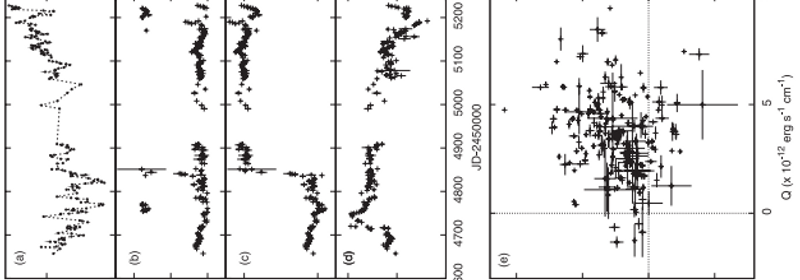
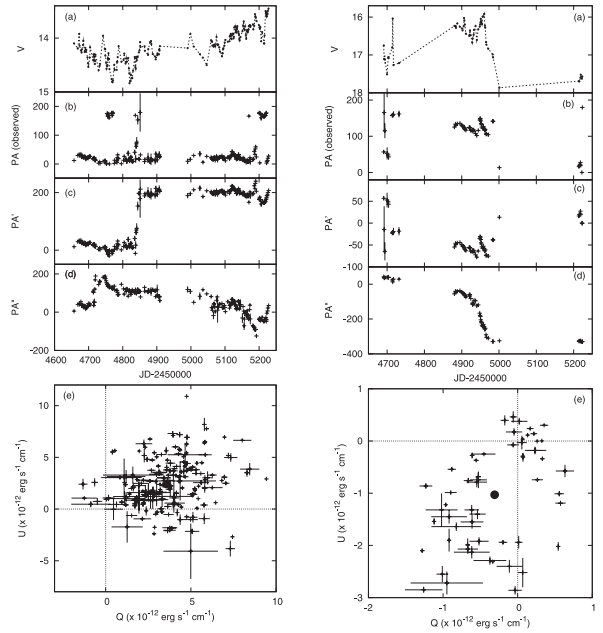
Optical polarization provides important clues to the magnetic field in blazar jets. It is easy to find noteworthy patterns in the time-series data of the polarization degree (PD) and position angle (PA). On the other hand, we need to see the trajectory of the object in the Stokes QU plane when the object has multiple polarized components. In this case, ironically, the more data we have, the more difficult it is to gain any knowledge from it. Here, we introduce TimeTubes, a new visualization scheme to explore the time-series data of polarization observed in blazars. In TimeTubes, the data is represented by tubes in 3D (Q, U, and time) space. The measurement errors of Q and U, color, and total flux of objects are expressed as the size, color, and brightness of the tubes. As a result, TimeTubes allows us to see the behavior of six variables in one view. We used TimeTubes for our data taken by the Kanata telescope between 2008 and 2014. We found that this tool facilitates the recognition of the patterns in blazar variations; for example, favored PA of flares and PA rotations associated with a series of flares.
Photopolarimetric Monitoring of Blazars

We report on the correlation between the flux, color, and polarization variations on time scales of days-months in blazars, and discuss their universal aspects. We performed monitoring of 42 blazars in the optical and near-infrared bands from 2008 to 2010 using TRISPEC attached to the “Kanata” 1.5-m telescope. We found that 28 blazars exhibited “bluer-when-brighter” trends in their whole or a part of time-series data sets. This corresponds to 88% of objects that were observed for >10 days. Thus, our observation unambiguously confirmed that the “bluer-when-brighter” trend is common in the emission from blazar jets. This trend was apparently generated by a variation component with a constant and relatively blue color and an underlying red component. Prominent short-term flares on time scales of days-weeks tended to exhibit a spectral hysteresis; their rising phases were bluer than their decay phases around the flare maxima. In contrast to the strong flux-color correlation, the correlation of the flux and polarization degree was relatively weak; only 10 objects showed significant positive correlations. Rotations of polarization were detected only in three objects: PKS 1510-089, 3C 454.3, and PKS 1749+096, and possibly in S5 0716+714. We also investigated the dependence of the degree of variability on the luminosity and the synchrotron peak frequency, νpeak. As a result, we found that lower luminosity and higher νpeak objects had smaller variations in their amplitudes both in the flux, color, and polarization degree. Our observation suggests the presence of several distinct emitting sources, which have different variation time-scales, colors, and polarizations. We propose that the energy injection by, for example, internal shocks in relativistic shells is a major factor for blazar variations on time scales of both days and months.

ike11blazar

This work was published in PASJ, as 2011PASJ…63..639I.

1 2