[bioinfo]Nanoporeのベースコールクオリティを比較してみた。その二
次は現行のMinKNOW(release 19.12.5)のベースコーラーとGuppy Gpu (v.3.5.1)を比較してみた。データは今回行った比較的うまく行ったラン。
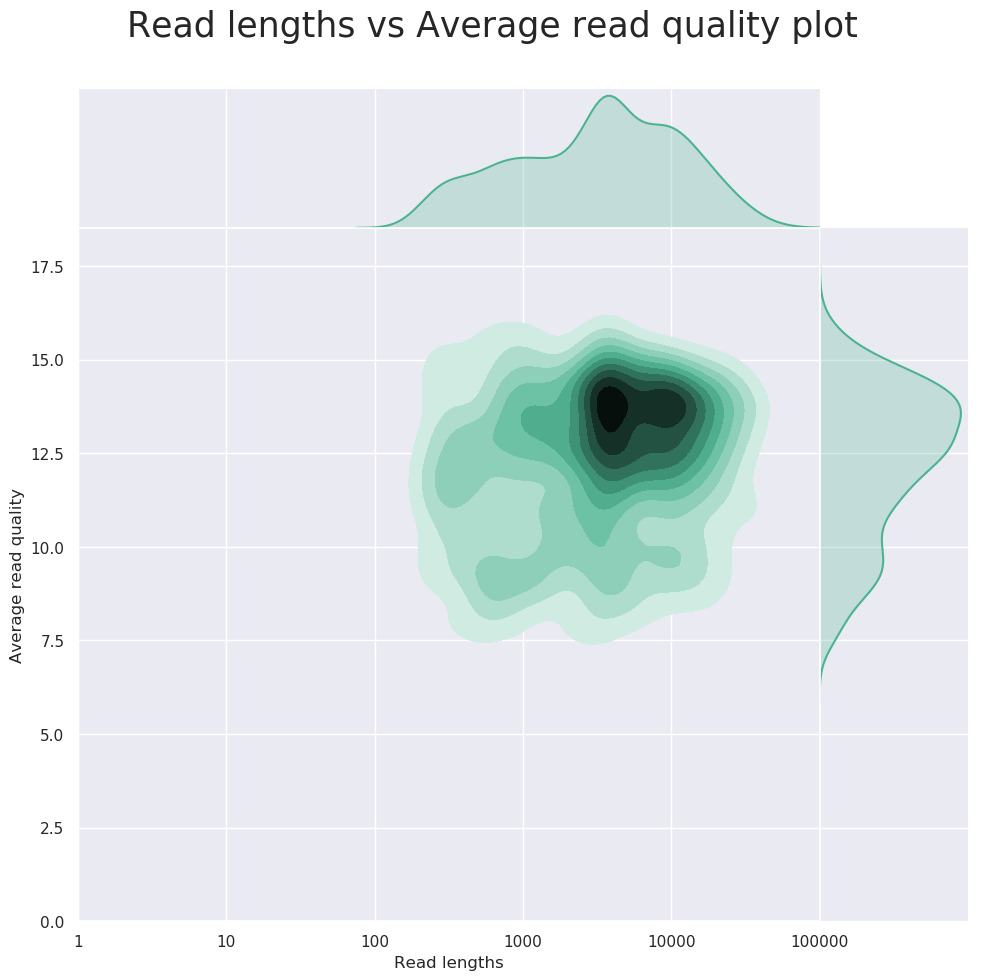
MinKNOW (release 19.12.5)
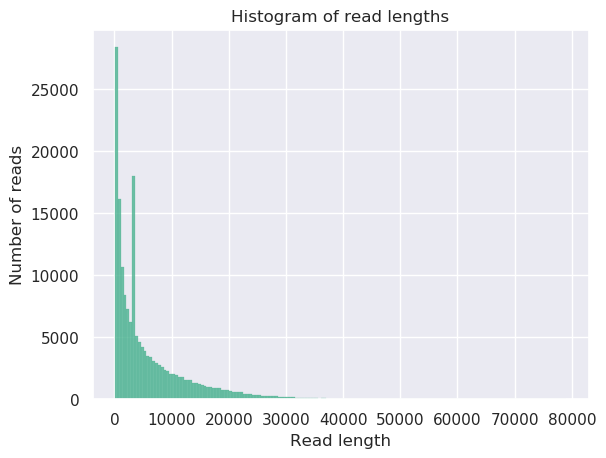
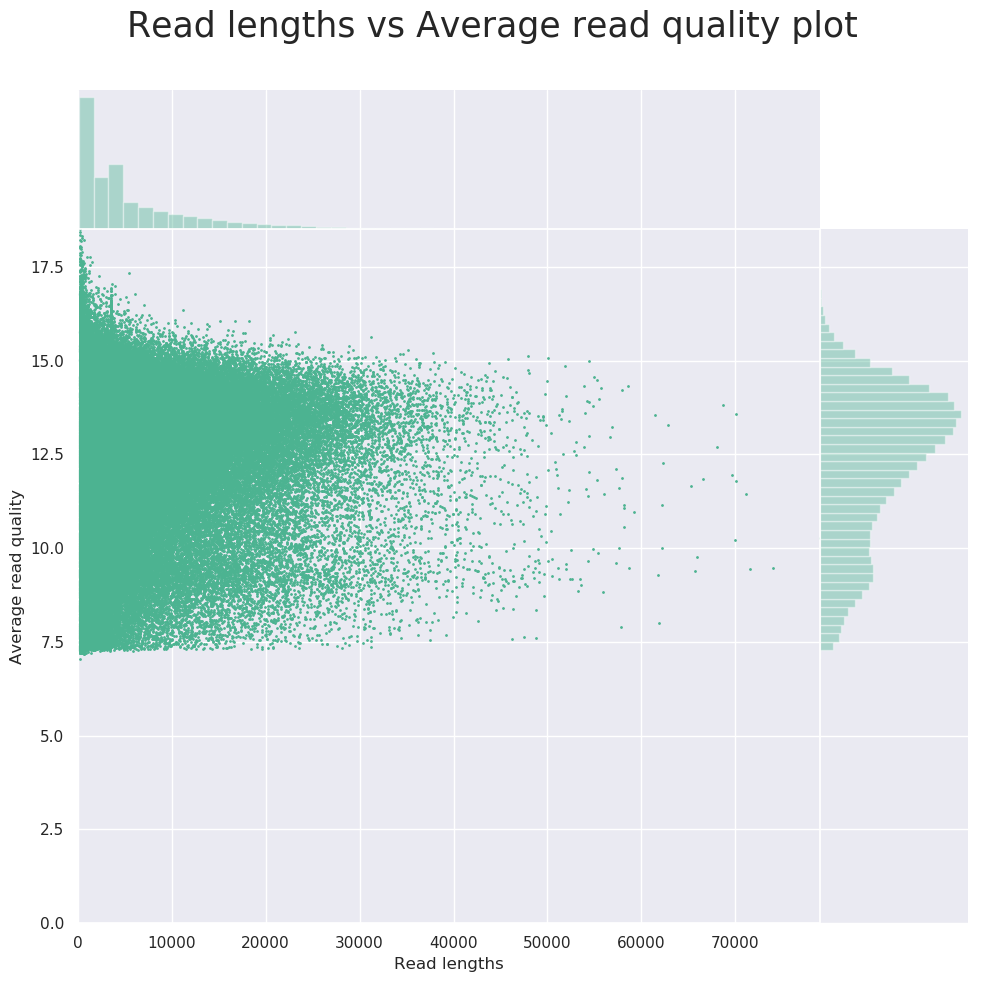
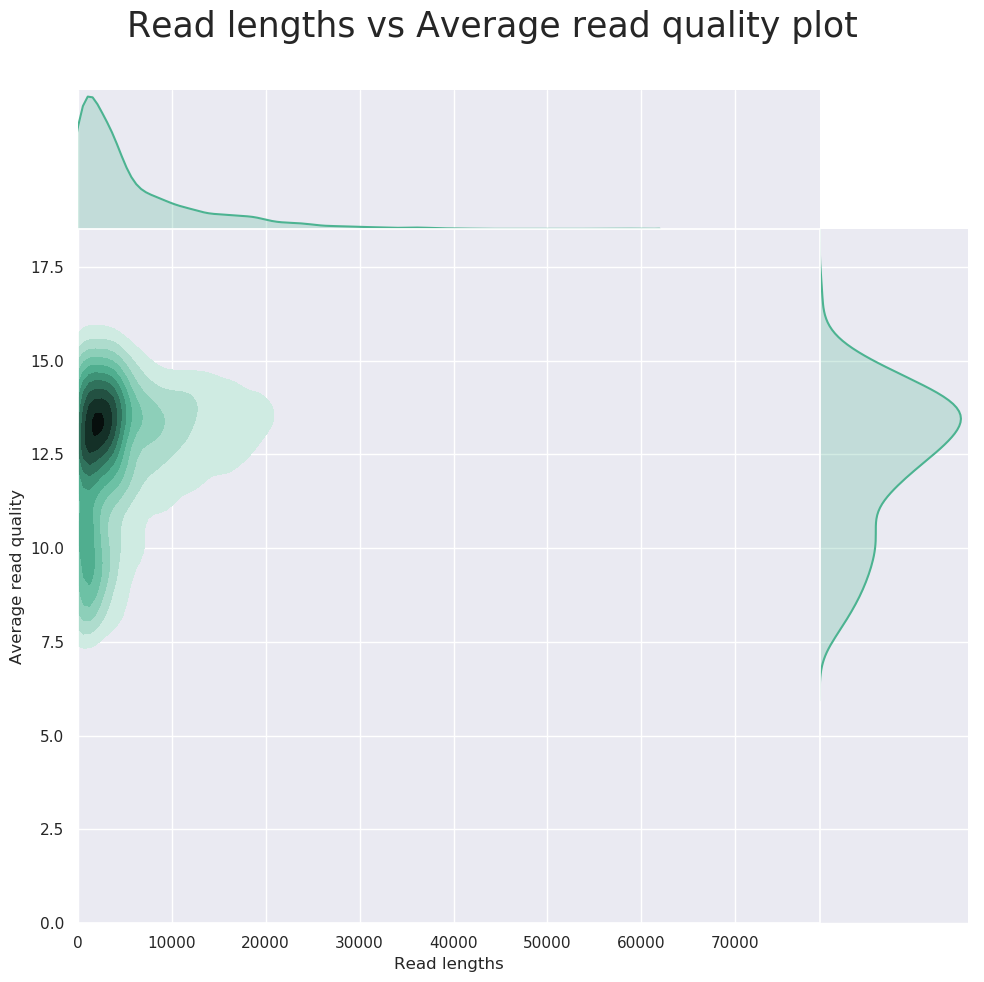
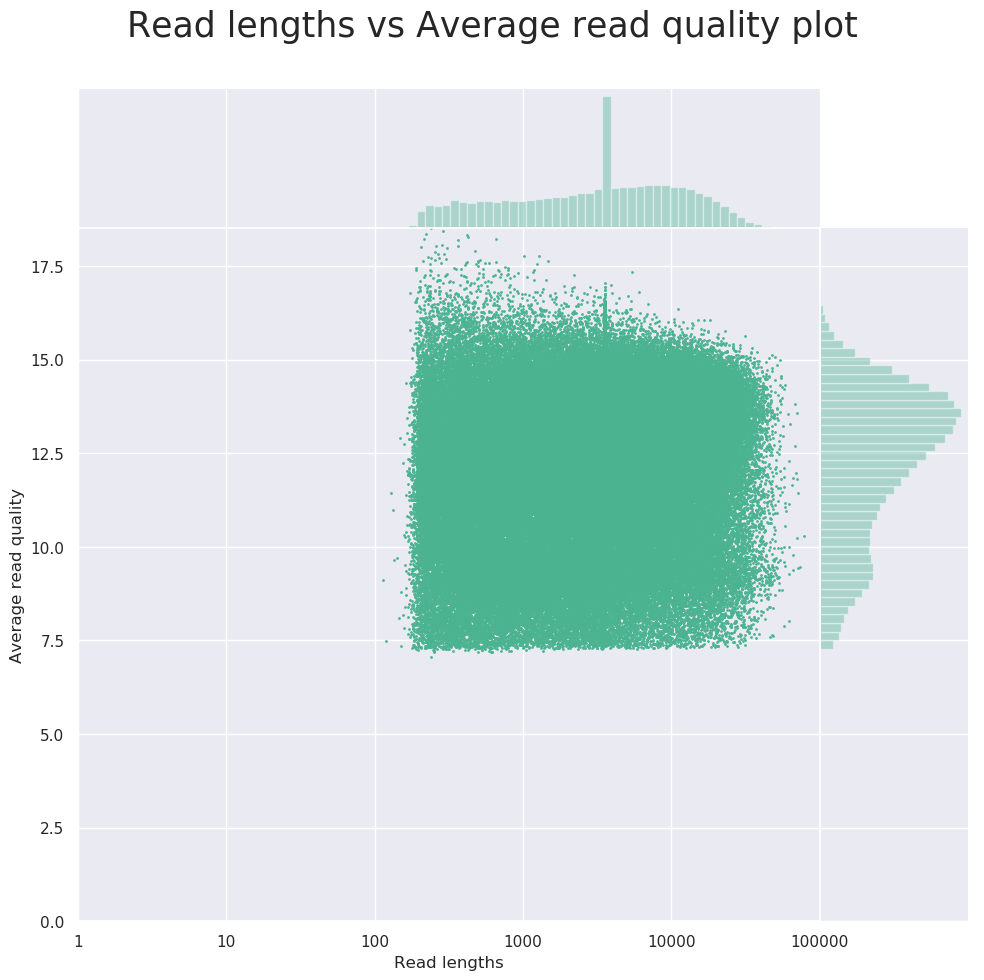
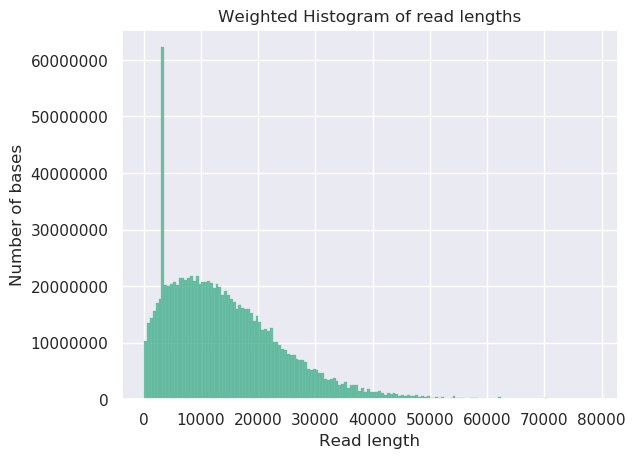
General summary: Mean read length: 6,006.3 Mean read quality: 12.3 Median read length: 3,532.0 Median read quality: 12.7 Number of reads: 172,664.0 Read length N50: 12,406.0 Total bases: 1,037,070,203.0 Number, percentage and megabases of reads above quality cutoffs Q5: 172664 (100.0%) 1037.1Mb Q7: 172664 (100.0%) 1037.1Mb Q10: 143186 (82.9%) 900.4Mb Q12: 106061 (61.4%) 700.0Mb Q15: 7493 (4.3%) 26.8Mb Top 5 highest mean basecall quality scores and their read lengths 1: 18.5 (242) 2: 18.4 (291) 3: 18.4 (222) 4: 18.3 (418) 5: 18.3 (426) Top 5 longest reads and their mean basecall quality score 1: 78972 (10.3) 2: 73960 (9.5) 3: 71546 (9.4) 4: 71123 (11.4) 5: 70049 (13.6)
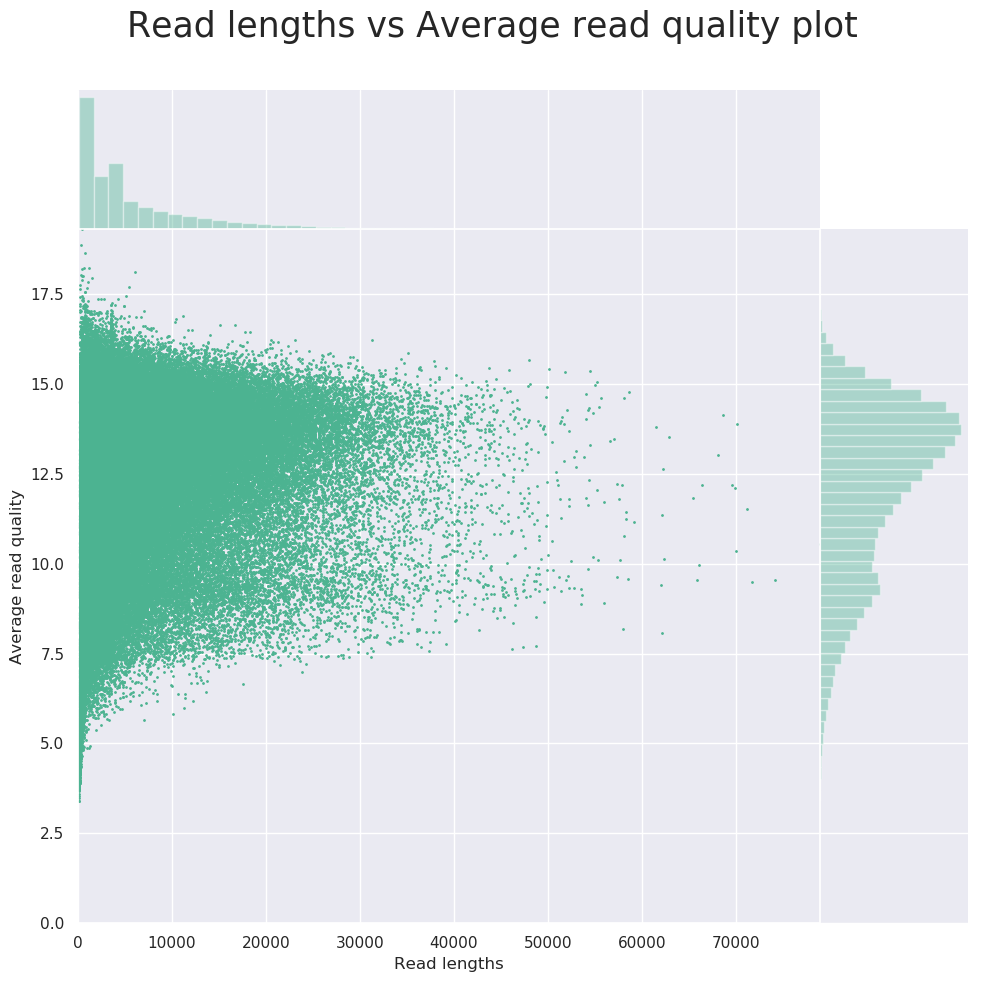
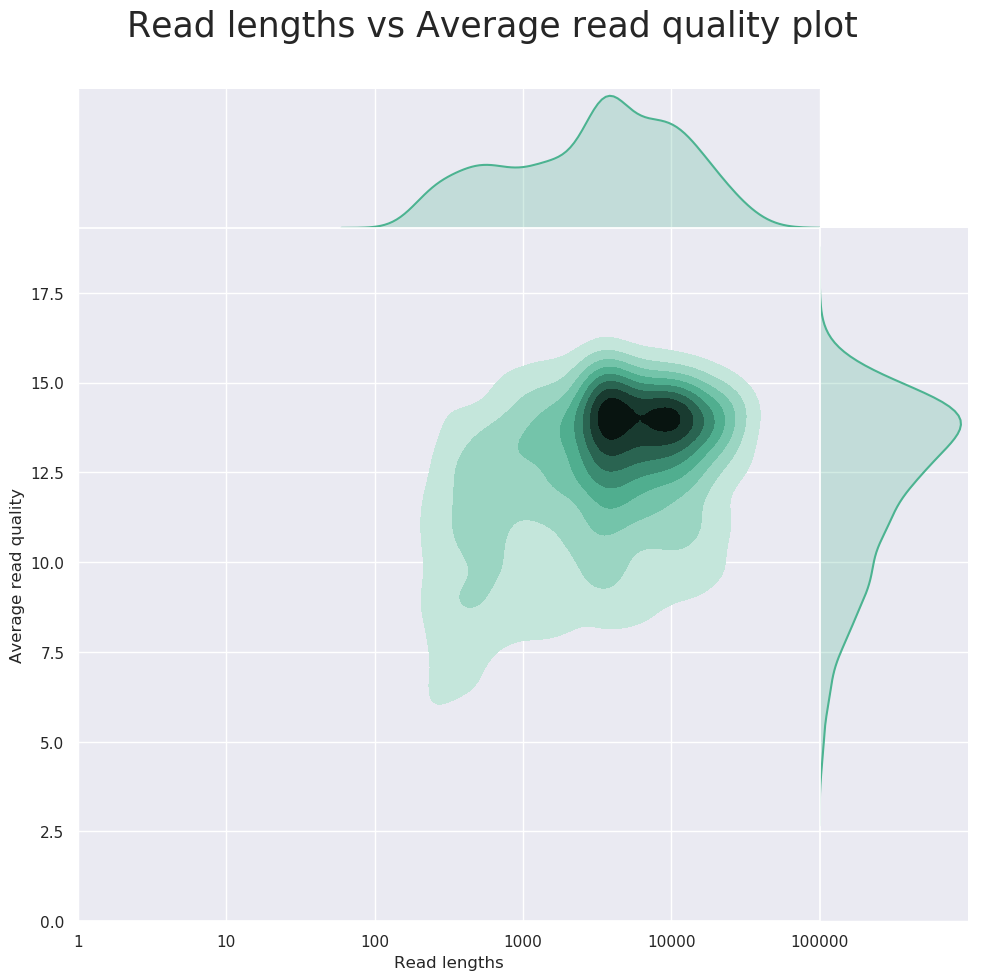
![](https://home.hiroshima-u.ac.jp/~tigawa/wp-content/uploads/2020/04/HistogramReadlength-5.png)
![](https://home.hiroshima-u.ac.jp/~tigawa/wp-content/uploads/2020/04/LengthvsQualityScatterPlot_dot-3.png)
![](https://home.hiroshima-u.ac.jp/~tigawa/wp-content/uploads/2020/04/LengthvsQualityScatterPlot_kde-3.png)
![](https://home.hiroshima-u.ac.jp/~tigawa/wp-content/uploads/2020/04/LengthvsQualityScatterPlot_loglength_dot-3.png)
![](https://home.hiroshima-u.ac.jp/~tigawa/wp-content/uploads/2020/04/LengthvsQualityScatterPlot_loglength_kde-4.png)
![](https://home.hiroshima-u.ac.jp/~tigawa/wp-content/uploads/2020/04/LogTransformed_HistogramReadlength-3.png)
![](https://home.hiroshima-u.ac.jp/~tigawa/wp-content/uploads/2020/04/Weighted_HistogramReadlength-3.png)
![](https://home.hiroshima-u.ac.jp/~tigawa/wp-content/uploads/2020/04/Weighted_LogTransformed_HistogramReadlength-3.png)
![](https://home.hiroshima-u.ac.jp/~tigawa/wp-content/uploads/2020/04/Yield_By_Length-3.png)
Guppy GPU (v.3.5.1)
General summary: Mean read length: 6,008.0 Mean read quality: 12.1 Median read length: 3,534.0 Median read quality: 12.6 Number of reads: 172,664.0 Read length N50: 12,398.0 Total bases: 1,037,358,216.0 Number, percentage and megabases of reads above quality cutoffs Q5: 172149 (99.7%) 1037.3Mb Q7: 167715 (97.1%) 1034.4Mb Q10: 136102 (78.8%) 904.9Mb Q12: 102572 (59.4%) 726.6Mb Q15: 10643 (6.2%) 62.4Mb Top 5 highest mean basecall quality scores and their read lengths 1: 19.3 (442) 2: 18.9 (371) 3: 18.7 (820) 4: 18.2 (694) 5: 18.2 (1169) Top 5 longest reads and their mean basecall quality score 1: 78864 (10.6) 2: 74095 (9.6) 3: 71656 (9.5) 4: 71161 (11.5) 5: 70031 (13.9)
![](https://home.hiroshima-u.ac.jp/~tigawa/wp-content/uploads/2020/04/HistogramReadlength-4.png)
![](https://home.hiroshima-u.ac.jp/~tigawa/wp-content/uploads/2020/04/LengthvsQualityScatterPlot_dot-2.png)
![](https://home.hiroshima-u.ac.jp/~tigawa/wp-content/uploads/2020/04/LengthvsQualityScatterPlot_kde-2.png)
![](https://home.hiroshima-u.ac.jp/~tigawa/wp-content/uploads/2020/04/LengthvsQualityScatterPlot_loglength_dot-2.png)
![](https://home.hiroshima-u.ac.jp/~tigawa/wp-content/uploads/2020/04/LengthvsQualityScatterPlot_loglength_kde-3.png)
![](https://home.hiroshima-u.ac.jp/~tigawa/wp-content/uploads/2020/04/LogTransformed_HistogramReadlength-2.png)
![](https://home.hiroshima-u.ac.jp/~tigawa/wp-content/uploads/2020/04/Weighted_HistogramReadlength-2.png)
![](https://home.hiroshima-u.ac.jp/~tigawa/wp-content/uploads/2020/04/Weighted_LogTransformed_HistogramReadlength-2.png)
![](https://home.hiroshima-u.ac.jp/~tigawa/wp-content/uploads/2020/04/Yield_By_Length-2.png)
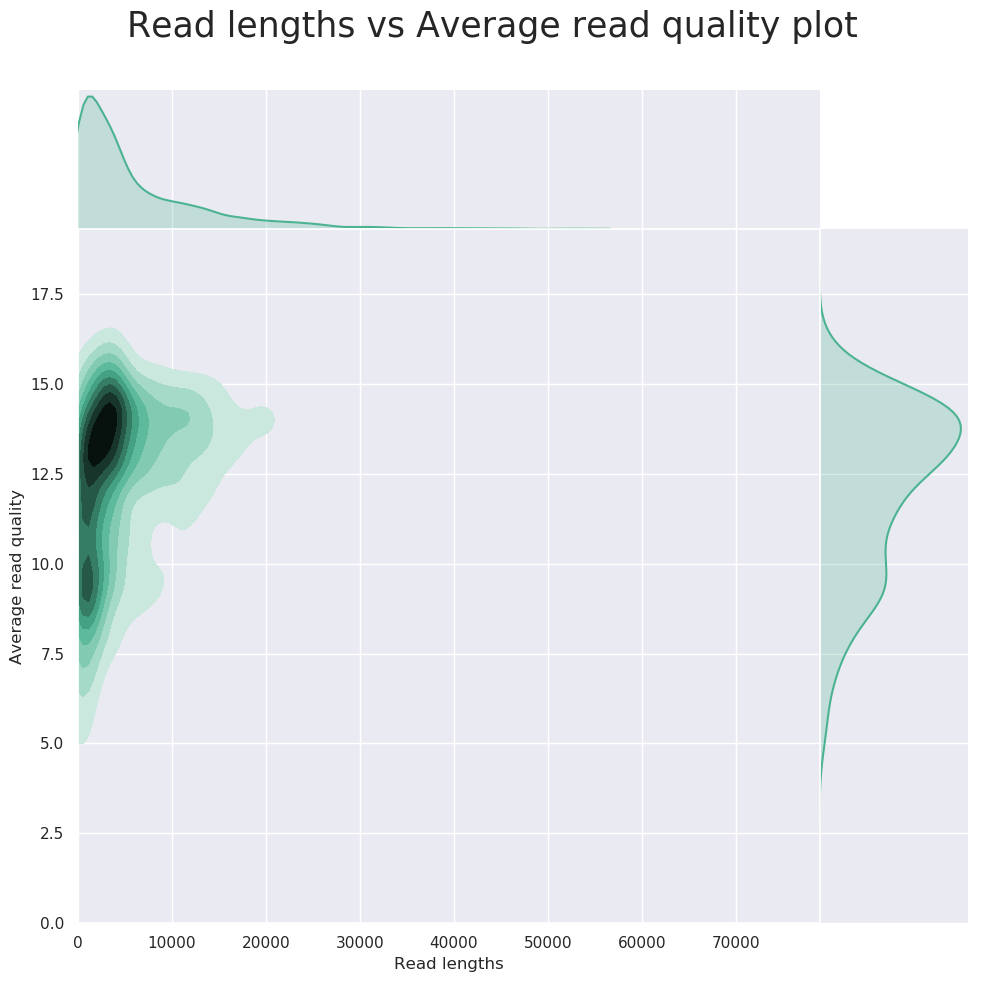
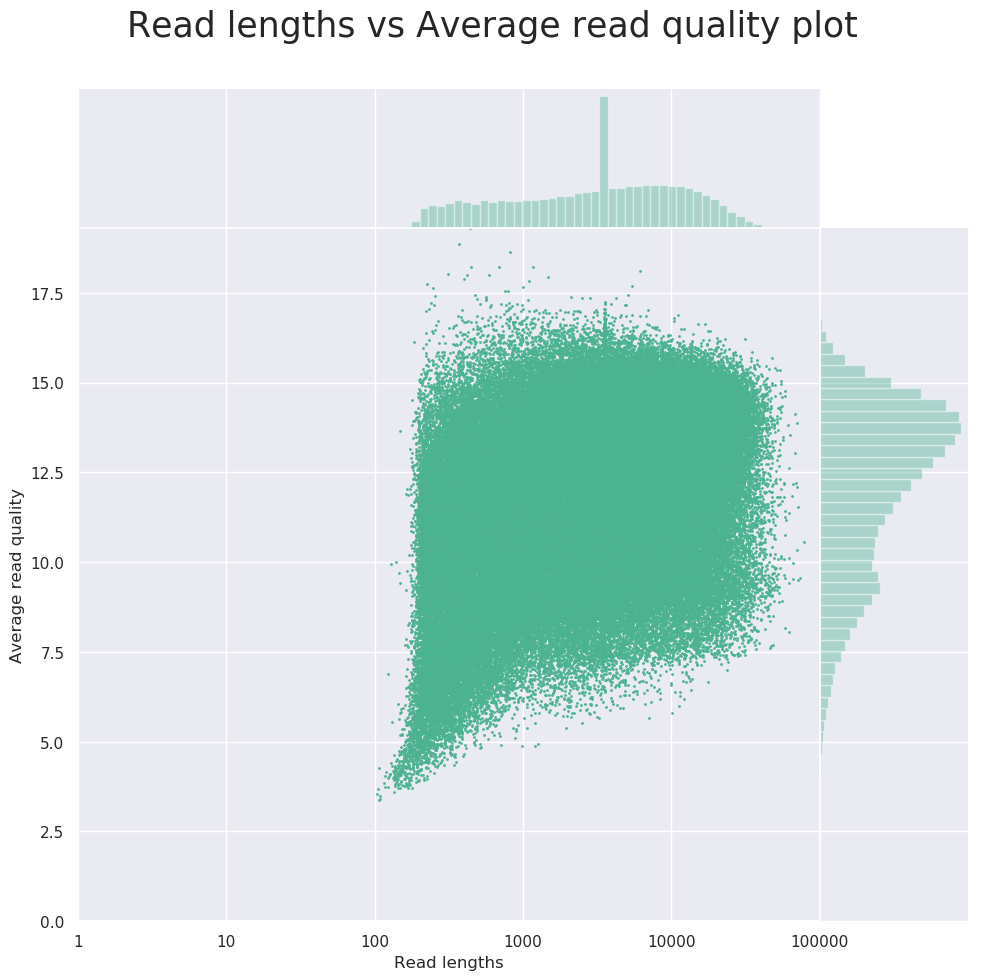
MinKNOWのベースコーラーは平均Q値約7.5以下のリードを排除している様子。