plot_bathy.sh for checking the bathymetry input
#!/bin/sh
infn=bathymetry   # xyz file
psfn=bathy
region=156.75/210/-65/-23.75/-9500/5
gmt psxyz $infn -JQ180/15 -JZ5c -Bx5+llong -By5+llat -Bz2500+lbathymetry -B+t"3D bathymetry" -R$region -Sc0.025 -Ggray -p135/70 -W -P -V > $psfn.eps
gs $psfn.eps
plot_tide.sh for checking the M2 tide amplitude and phase
#!/bin/sh
infn=coefficients
psfn=amplitude
region=168.3/179.6/-45.1/-36.5
rm -f $psfn.eps
# Amplitude
 awk '{print $1,$2,$3}' < $infn | gmt psxy -JQ174/12 -Bx2+llong -By2+llat -BWSne+t"M2 amplitude" -R$region -Sc0.15 -Camp.cpt -P -V -K > $psfn.eps
 gmt psscale -Camp.cpt -DjMR+w7.5c+o-2.5c/0 -R -J -I -Bx0.25+lAmplitude -By+lm -V -O -K >> $psfn.eps
# Phase
awk '{print $1,$2,$4}' < $infn | gmt psxy -JQ174/12 -Bx2+llong -By2+llat -BWSne+t"M2 phase" -R$region -Sc0.15 -Cpha.cpt -V -K -Y13c -O >> $psfn.eps
 gmt psscale -Cpha.cpt -DjMR+w7.5c+o-2.5c/0 -R -J -I -Bx30+lphase -By+ldeg -V -O >> $psfn.eps
 #
 gs $psfn.eps
Tide GTS input files using the Nao Tide dataset
Download the Nao tide dataset and src from
https://www.miz.nao.ac.jp/staffs/nao99/index_En.html
Then, run the following to check the tidal amplitude and phase
$ gfortran -o nao2xyap nao2xyap.f
$./nao2xyap < m2.nao > m2.nao.xyap
$ gmt info m2.nao.xyap # to check the xyap file and get the attribute for domain
Then, run the following script, plot_tide.sh, to plot the tidal charts
#!/bin/sh
infn=o1.nao.xyap
psfn=o1tide.nao
region=0/360/-90/90
rm -f $psfn.ps
 # Amplitude (centi-metre:cm)
 gmt makecpt -Ccool -T0/100/20 -V > amp.cpt
 awk '{print $1,$2,$3}' < $infn | gmt psxy -JQ180/14 -Bx60+llong -By30+llat -BWSne+t"NaoTide O1 amplitude" -R$region -Sc0.015 -Camp.cpt -P -V -K > $psfn.ps
 gmt psscale -Camp.cpt -DjMR+w7.0c+o-2.5c/0+e -R -J -I -Bx20+lAmplitude -By+lcm -V -O -K >> $psfn.ps
# Phase (degree)
 gmt makecpt -Ccool -T0/360/30 -V > pha.cpt
 awk '{print $1,$2,$4}' < $infn | gmt psxy -JQ180/14 -Bx60+llong -By30+llat -BWSne+t"NaoTide O1 phase" -R$region -Sc0.015 -Cpha.cpt -V -K -Y12c -O >> $psfn.ps
 gmt psscale -Cpha.cpt -DjMR+w7.0c+o-2.5c/0 -R -J -I -Bx30+lphase -By+ldeg -V -O >> $psfn.ps
 #
 gs $psfn.ps
 ps2epsi $psfn.ps
 convert $psfn.epsi $psfn.png
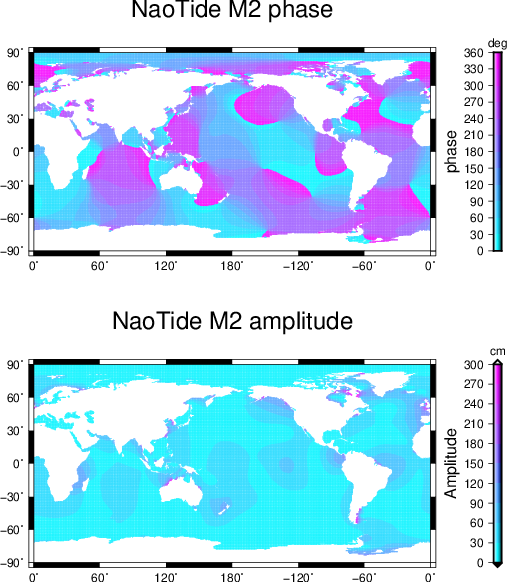
The resulting $psfn.png (m2tide.nao.png) is like below
Repeat the same process for S2, K1, O1, and so on.
Finally, make the gts files of each tidal constituents for GFS modelling by running nao2gts.sh
## tidal coefficients#
 tide=s2
 Agtsfn=AS2.gts
 Bgtsfn=BS2.gts
 infn=$tide.nao.xyap
 gmt info $infn
# input file should contain the amplitude and phase of tidal constituents as a function of space i.e. four columns:
# lon (deg) lat (deg) amplitude (m) phase (degree:-180/180)
# therefore, check the units
tmpfn=$infn.new

awk '{if ($4 > 180.0) print $1,$2,$3/100,$4-360; else print $1,$2,$3/100,$4}' $infn > $tmpfn

gmt info $tmpfn
# just counts the number of lines in the input file
lines=wc -l $tmpfn | awk '{print $1}'

echo "lines = " $lines
# Gerris defines the tidal M2,S2,K1,O1 mode as:
# AM2*cos(omega*t) + BM2*sin(omega*t)
## We first compute AM2 from the amplitude and phase.
awk -v lines=$lines '
BEGIN {
  print lines " 0 0"
} {
  print $1 " " $2 " " $3*cos($43.14159265357/180.)
}' < $tmpfn | delaunay > $Agtsfn
#
# Now compute BM2
awk -v lines=$lines '
BEGIN {
  print lines " 0 0"
} {
  print $1 " " $2 " " $3*sin($43.14159265357/180.)
}' < $tmpfn | delaunay > $Bgtsfn